Οι πιο σημαντικές μετρήσεις ανθρώπινου δυναμικού και παραδείγματα για την αποτελεσματική χρήση τους
Zuletzt updated:
19.12.2023
Lesezeit:
14 λεπτά
última actualización
19.12.2023
χρόνος ανάγνωσης
14 λεπτά
Τελευταία ενημέρωση:
19 Δεκεμβρίου 2023
Ώρα για διάβασμα:
14 λεπτά
When it comes to people operations, most of us envision the subjective and social aspects of the job: reading people, enforcing compliance, and dealing with conflicting personalities.
Metrics, data, analytics? You'd probably associate them with finance geeks or tech wizards. However, HR metrics are also the lifeblood ofmodern strategic HR.
But with countless metrics out there, which ones truly matter?
Which are mere distractions, and which are pivotal for organizational success?
More importantly, how do you use them effectively?
This article will answer these questions. We will:
Showcase the most crucial HR metrics that you should be tracking.
Analyze why they are critical in every business.
Illustrate how to use them effectively for your company.
Provide some examples and formulas you can apply to your own people operations dashboard.
📟 What are HR metrics?
HR metrics are quantitative data that relate directly or indirectly to your human resources department and its effects. This data helps determine the value, trends, and outlook of your HR team.
An example of direct HR metrics would be HR cost per employee. Simply divide the total amount spent on HR by the number of employees who benefit from that work for an average cost per employee. This can help determine if your company spends a reasonable amount on people operations compared to other companies in your industry.
An example of indirect HR metrics would be the absenteeism rate. By tallying the total number of absences for all employees over a given amount of time, divided by the number of employees, you can see an average of absenteeism across your organization. This example is indirect because while human resources have some control over absenteeism with employee policies, they do not directly control external circumstances that result in employee absence.
What is an HR metrics dashboard?
An HR metrics dashboard is a centralized digital solution for tracking and analyzing KPIs for people operations. These dashboards can facilitate the management of company-wide, departmental, or even individual performance and progress.
The dashboard can be made available to HR, all management, or everyone, including the individuals whose performance is being monitored.
HR metrics dashboard on Zavvy
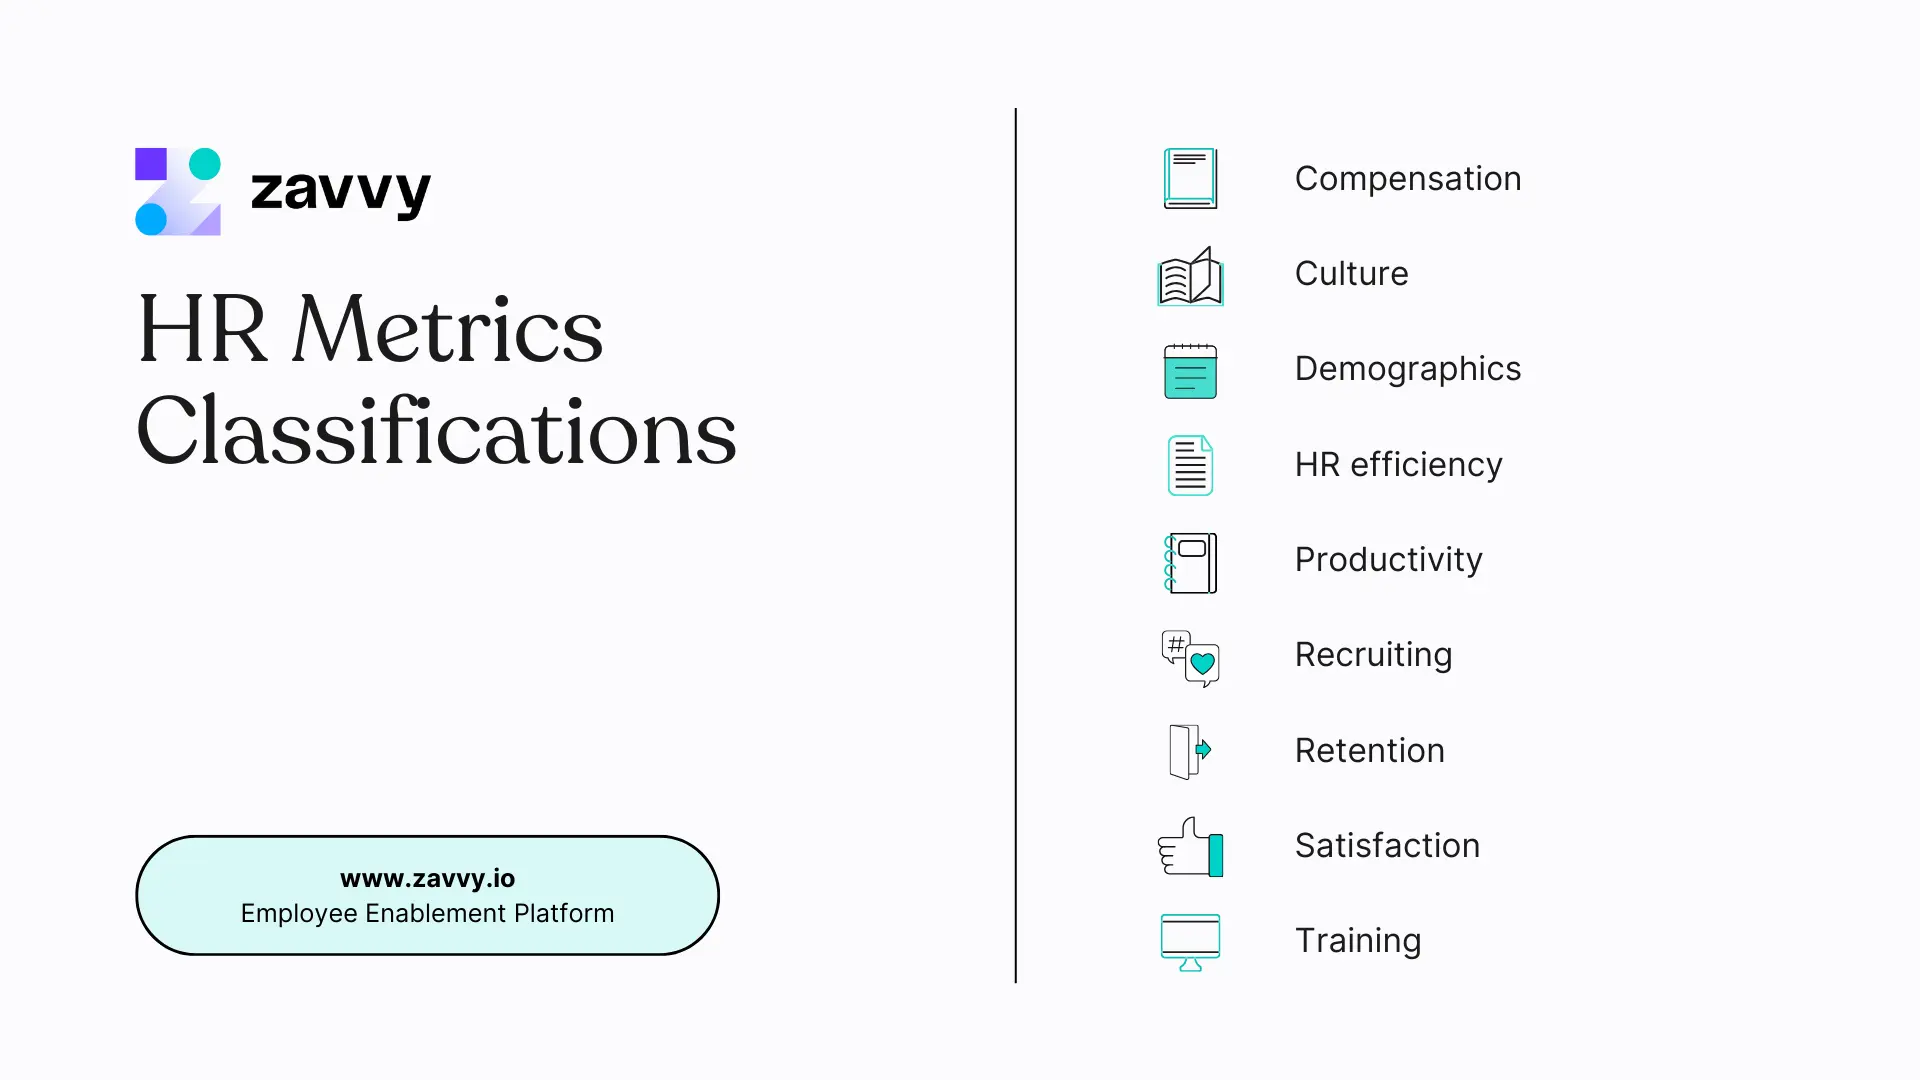
HR metrics classifications
Beyond direct and indirect metrics related to your HR team, these metrics can be broken down into other classifications depending on which areas of your operation they most closely relate to.
A Common classification includes:
αποζημίωση,
culture;
demographics;
HR efficiency;
παραγωγικότητα,
στρατολόγηση,
retention;
satisfaction;
training.
We will fill these categories with specific metrics below.
🔢 29 HR metrics examples to take the pulse of HR
Below are 29 examples of HR metrics. This is by no means an exhaustive list, nor are these examples or categories prioritized in any particular manner.
In fact, there never will be a complete list of HR metrics, as the industry is constantly evolving and changing alongside technology and social expectations.
For example, before computer technology became commonplace for businesses, there was no concept of HR automation! And, of course, there are other ways to filter or classify these metrics, such as by department, focus areas of the organization, or type of benefit (i.e., cost savings, time savings, employee satisfaction, compliance, etc.).
The important thing is to utilize the metrics that are relevant and beneficial to your organization and goals. You will probably use some of the examples in this list. Still, it is unlikely you will use all of them, and likely, you will come up with others not included below, now or in the future.
1. Workforce
This subsection includes basic information about your overall workforce. This data may not have a ton of use in and of itself, but it can be instrumental for other calculations.
Some key HR metrics about your workforce include:
Average tenure
Calculating average tenure is a simple stat that can provide insight into several other areas. Knowing how long employees tend to hold a position can signal contentment but also stagnation.
Headcount
Headcount is simply the total number of employees in your organization. This metric can be broken down into full-time, part-time, contract workers, etc., to gain further insights or apply calculations to specific categories of employees.
Cost of workforce
The cost of workforce measures the total operational cost of your staff. This includes salaries, benefits, and employee expenses (i.e., coffee) but not operational expenses (like PPE or fuel).
HR to employee ratio
This metric simply measures the ratio between people operations and regular employees. An efficient HR department will require fewer members per employee than a less efficient one. On the other hand, a higher ratio may be more effective at fulfilling HR-related goals.
Salary averages
Calculating average salary by department, level, or for the entire company is a good base for many other helpful calculations (pay discrepancies, raise potential, cost per employee, etc.). Simply find the sum of your entire payroll for a set period (recent, past, or current) and divide it by the total number of employees in the group you are measuring.
2. Recruiting
Hiring and onboarding are some of the most critical duties of people operations, making this data invaluable. Knowing who to hire, how much it will cost, and how long to find them are vital to overall business strategies.
The total expense per new hire should include the talent search fees, time spent reviewing applications and interviewing, sign-on bonuses, or other new employee expenses. Average this amount by department or level as desired or for the entire company.
Ώρα για πρόσληψη
Knowing how long it takes from when a job opening is created to when it is filled is helpful for practical decisions. Also, it speaks to the efficiency of your recruiting process. Average this time by department or level as sensible.
Interviews per hire
This metric is related to the two above, calculating the success rate of interviews. Simply calculate what percentage of candidates interviewed are hired (in other words, how many discussions are needed to find a worthy candidate) to arrive at this value.
Ποιότητα της μίσθωσης
While it is essential to keep the cost per hire and time to hire low, it is more important to keep the quality of hires high.
Hiring the right candidate who is well-suited for their role and satisfied with their position will reduce recruiting expenses (by avoiding situations in which the person will not make it past the probation period or if the employees themselves quit early on).
First-year turnover rate
An employee's first anniversary is a major milestone.
A low or shrinking new hire turnover rate implies positive trends in recruiting and onboarding. At the same time, a high or growing number is a major red flag that needs immediate attention.
Vacancy rate
The goal of recruiting is to fill positions. Tracking the number of vacancies at any given time can show how recruitment efforts are stacking up to resignations and promotions. Maintaining low vacancy rates is also an easy performance indicator for people operations.
3. Retention
Retaining employees is more manageable than recruiting new ones, making this one of the most valuable parts of effective HR. Retention metrics include:
Ποσοστό δέσμευσης
Disengaged employees are unfulfilled employees. By monitoring engagement, you can keep employees active and happy so they don't wonder about the grass being greener elsewhere.
Consider using survey questions such as "How fulfilled are you in your role on a scale of 1-10?" and indirect data like absenteeism for a more complete picture.
Employer Net Promoter Score is a measurement of employee satisfaction and loyalty. It is measured by a simple one-question survey rating employee satisfaction on a scale of 1-10.
But you can create eNPS surveys that go a step further.
An easy statistic to track for employee satisfaction and retention is the number of grievances submitted. Sudden spikes or the relation between grievances and turnover can indicate needed action.
Promotion rate
Upward momentum is a powerful tool for employee satisfaction (especially for ambitious workers). The promotion rate can be calculated in several ways. The most common is the average time between employee promotions (i.e., most employees receive a promotion every four years). In some organizations, it may be more helpful to measure what percentage of employees received a promotion in a given timeframe.
Employee benefits like PTO are a significant factor when it comes to retention. Tracking how many vacation days are used can be helpful for budgeting, workforce scheduling, and even employee engagement/satisfaction. This data can also help enforce mandatory time off.
4. Απόδοση
Performance management metrics are more indirect, suggesting ways people operations can better support employees to reach their full potential.
Positively influencing performance metrics is one of the most value-adding services provided by human resources specialists.
Ξεκλειδώστε ένα νέο επίπεδο επιδόσεων και δεξιοτήτων των εργαζομένων με το Zavvy
Απουσία
Tracking the average number of absences per employee for a given time frame can provide many insights for individuals and company-wide. The goal should be to reduce or maintain this number at a healthy level, addressing outlying employees as needed.
Productivity rate
A measure of productivity is a direct metric for performance. How you measure productivity will depend on your organization and the roles of your employees, but this is a key statistic when it comes to worker performance and has a significant impact on company success.
Έσοδα ανά εργαζόμενο
Calculating revenue per employee can be done with averages or on a more individual basis/ Calculating the ROI per salesperson, for example, gives a baseline for supporting those behind the curve and learning from those ahead of it. In a general sense, divide total revenue by the number of employees for a general sense of each member's value and overall operation efficiency.
Goal completion rate
The goal completion rate measures the percentage of assigned goals or objectives that employees successfully achieve within a specified time frame. It's a direct indicator of how effectively individuals or teams are accomplishing their designated tasks and contributing to the organization's broader objectives.
Goals and sub-goals on Zavvy
To calculate the goal completion rate, divide the number of successfully completed goals by the total number of goals set for the period, then multiply by 100 to get a percentage.
This metric helps in identifying areas where employees may need more support or resources, and it can be instrumental in recognizing high performers.
The ability to accurately track how employees spend their time presents many opportunities for people operations. Here, it is vital to optimize the time spent on more critical, income-generating tasks.
5. Leadership effectiveness
Often, companies fixate on tracking the performance of the hands-on workers at the bottom of the totem pole when, in fact, it is often more critical to prioritize management. Managers are a force multiplier, impacting the performance of everyone they oversee. Measuring and enhancing the effectiveness of your leaders will positively affect everyone.
Subordinate satisfaction
A simple survey asking employees their opinions about a supervisor can provide useful information. By crowdsourcing data, you can evaluate consensus in a manager's performance, including their strengths or areas for improvement.
Training is another critical aspect of people operations and provides plenty of data to learn from. Important training metrics for HR include:
New hire time to productivity
New hire time to productivity (or NHTTP) measures how long it takes before a new employee is fully productive in their role due to training. The faster new hires are brought up to speed and contributing in full force, the quicker they begin adding value to the company rather than draining resources. Reducing this window without cutting corners or limiting potential is a massive win for people operations.
Training cost per employee
Training is an investment in your workforce. As with any investment, it is wise to know the upfront costs before you dive in. Calculating how much you spend on average to train each employee can help with budgeting and identifying opportunities to save money.
Προϋπολογισμοί κατάρτισης στο Zavvy
Training ROI
The other half of the training investment is measuring the payout. If spending money on training isn't resulting in more success for the company, it may be a reason to question whether that training is necessary or worthwhile. You can also calculate which training methods are most effective this way.
7. D&I Metrics
Diversity and inclusion metrics ensure a well-rounded and inviting workplace. This not only includes demographic breakdowns but can also be used to cross-reference stats like pay equity and fairness in opportunities such as promotion.
Diversity ratios can be calculated for several categories, such as age, race, and gender.
For example, you can calculate the gender ratio as a percentage using an easy-to-understand pie chart.
Pay equity
With diversity ratios calculated, you can use that data to calculate pay equity. This ensures pay and opportunities such as promotion are being fairly distributed.
For example, cross reference pay by age and pay by experience to ensure compensation is duly dispersed.
8. HR Automation
Virtually every industry can benefit from automation in one way or another. Despite the focus on people in the HR world, automation tools still have a lot to offer, especially when it comes to more technical or data-oriented tasks. Here are some strategic HR metrics related to automation:
HR automation software utilization
Calculating HR automation software utilization as a ratio can help you identify opportunities or compare your usage with your goals or other companies in your industry.
Automation adoption
By tracking HR automation software utilization over time, you can track trends in your automation adoption.
For example, if you started at around 10% of HR duties being assisted by automation and have a goal of reaching 25% over three years, you would want to find solutions to automate an additional 5% of your duties per year. This data can also be calculated historically.
Automation effectiveness
Measuring the effectiveness of automation can be done in several ways and depends on what you are automating.
For example, suppose automation is saving your time on HR tasks. In that case, you can measure effectiveness as a ratio of time saved or efficiency percentage increase. You could go further by calculating the work hours and, therefore, money saved by automation.
📈 How HR metrics form the basis of data-driven decision-making for PeopleOps
Since people operations traditionally deals with diverse individuals and short interviews, the duties of this department were often just accepted to be subjective. What separated a good HR professional from a great one was their "gut" and people skills.
This old-school way of thinking is left in the dust as modern people operations best practices turn to data and transparency to deliver meaningful, measurable results.
In the fiercely competitive hiring market of today, gambling with five-, six-, or even seven-figure salaries because you "like" someone or "have a good feeling about them" isn't enough. These crucial decisions need to be informed and supported by data.
The same goes for equally important aspects of business like talent management and employee retention.
Understanding historical data that led to success or failure empowers people operations to reinforce positive trends and avoid negative ones.
For example, rather than hiring someone who "seems smart" in an interview, you can look at similarities among top performers and focus on applicants who share those traits.
By allowing HR metrics to inform your people strategy, you can eliminate a lot of the guesswork in favor of evidenced, repeatable patterns of success.
🤔 How to define your organization's HR KPIs
HR metrics are not universal, and different businesses will want to focus on different KPIs depending on the organization and objectives. You don't want to waste resources focusing on stats that aren't helpful or relevant to your goals and processes.
For example, a small company with a single person in charge of people operations probably doesn't need to track the HR ratio or cost of the department.
Consider your company's business strategy and key targets to help you focus on crucial KPIs. Ask executives what data or categories would be most valuable for them and the company.
In most cases, you will want a healthy variety of categories, including those focusing on leadership, operational efficiency, and individual performance. Employee well-being and spending are also key metrics for any company.
General, easy-to-calculate metrics (like the number of employees and cost to hire), coupled with goal-oriented KPIs, will allow you to monitor overall company trends while tracking progress within certain focus areas (i.e., hiring, turnover, employee experience, etc.).
Your focus areas will change over time, so start measuring what is most important now, and feel free to make changes as your company grows and shifts gears.
💡 7 Tips for using HR metrics strategically
Measurement is just the beginning: Simply recording HR metrics is the first step. How you use that data will make a difference for your company.
Integrate metrics into your overall strategy: Incorporate HR metrics into your overarching people analytics plan. This helps in tracking progress and determining which tactics yield results so you can allocate resources accordingly.
Let data guide decisions:Base people operations decisions on the metrics. This enhances outcomes and provides measurable proof of achievements.
Ensure accurate data collection: Invest in robust systems to gather data. Use the data to create case studies that showcase results and forecast growth.
Gather feedback regularly: Conduct regular surveys and questionnaires. These feedback tools provide insights into employee satisfaction and behavior changes over time.
Be mindful of collection methods: Sometimes, you will use obvious numbers like attendance records for your calculations. Other times, you will rely on subjective information like 360-degree feedback surveys. For subjective data, ensure questions are framed to minimize bias and get accurate responses.
Remember that consistency and transparency are key: Maintain a uniform system for metrics. Ensure the process is straightforward to everyone in the organization, making it easier for everyone to participate or follow along.
➡️ Measure, map, master HR metrics with Zavvy dashboards
Now that you know the importance of HR metrics and some specific examples of what you should measure, you can develop a system for recording and monitoring important data within your organization.
Zavvy's people enablement platform includes an HR metrics dashboard and everything you need to record and analyze vital KPIs.
Key performance indicators for human resources are different methods for measuring the efficiency of the department and their effectiveness with employees. Common KPIs for HR include time to hire, turnover rate, and HR cost per employee.
What are the most important HR metrics?
The most important HR metrics generally measure the effectiveness of your people operations. The average time and cost to fill a position, turnover rates, and employee satisfaction are all crucial. Quality of hires and compliance with internal and external regulations are also vital, depending on your industry.
Should all businesses use HR measurement?
If you aren't measuring it, you aren't managing it. You can't understand the value of your human resources department or improve it if you aren't measuring its efficiency and effects.
What are the 4 levels of HR metrics?
Analytics are often broken down into the following categories: predictive, prescriptive, descriptive, and diagnostic. Predictive HR metrics give an idea of what is likely to happen in the future, i.e., the expected number of employees by the end of the year. Prescriptive metrics explain how to make something happen, i.e., how much we need to spend on recruiting to find 10 more strong candidates. Descriptive metrics measure historical data, i.e., how many employees quit last year. Diagnostic metrics explain the results of historical data, i.e., most exit interviews identified pay as the leading cause for resignation.
How frequently should HR metrics be measured?
HR metrics aren't just a yearly performance review. It is the constant monitoring of different KPIs to track and act on changes or trends. Some metrics have obvious triggers, i.e., turnover when an employee resigns. Others are more equivocal, i.e., employee satisfaction surveys. In almost all cases, HR metrics should be measured as they occur or quarterly. Rarely should any HR metrics be calculated less than annually.
Lorelei Trisca
Η Lorelei είναι η υπεύθυνη μάρκετινγκ περιεχομένου της Zavvy. Βρίσκεται πάντα στο κυνήγι των τελευταίων τάσεων στον τομέα του ανθρώπινου δυναμικού, φρέσκων στατιστικών στοιχείων και βέλτιστων πρακτικών από την ακαδημαϊκή και την πραγματική ζωή για να διαδώσει τη λέξη για τη δημιουργία καλύτερων εμπειριών για τους εργαζόμενους.
.png)


.png)